Financial Highlights
(Millions of yen)
| 2019/3 | 2020/3 | 2021/3 | 2022/3 | 2023/3 | |
| Net Sales | 98,435 | 97,267 | 80,234 | 84,503 | 98,167 |
| Operating Income | 7,724 | 6,848 | 4,735 | 2,473 | 768 |
| Operating Margin(%) | 7.8% | 7.0% | 5.9% | 2.9% | 0.8% |
| Ordinary Income | 8,465 | 7,489 | 6,021 | 3,598 | 2,280 |
| Ordinary Margin(%) | 8.6% | 7.7% | 7.5% | 4.3% | 2.3% |
| Net Income | 4,915 | 4,486 | 2,697 | 2,105 | 2,109 |
| EBIDA | 10,455 | 10,678 | 8,803 | 8,152 | 8,590 |
| Total Assets | 68,293 | 66,001 | 71,211 | 72,463 | 75,538 |
| Net Assets | 110,591 | 103,843 | 115,616 | 115,631 | 126,133 |
| Net Income per Share, Basic | 251.04 | 229.15 | 137.76 | 107.47 | 109.51 |
| PBR(Price Book-Value Ratio) | 0.59 | 0.39 | 0.44 | 0.39 | 0.30 |
| PER(Price Eamings Ratio) | 7.6 | 5.3 | 10.9 | 12.6 | 10.4 |
| ROA(Return on Assets) | 6.6% | 6.4% | 4.3% | 2.1% | 0.6% |
| Net Assets to Total Assets(%) | 57.8% | 59.0% | 58.0% | 59.3% | 57.8% |
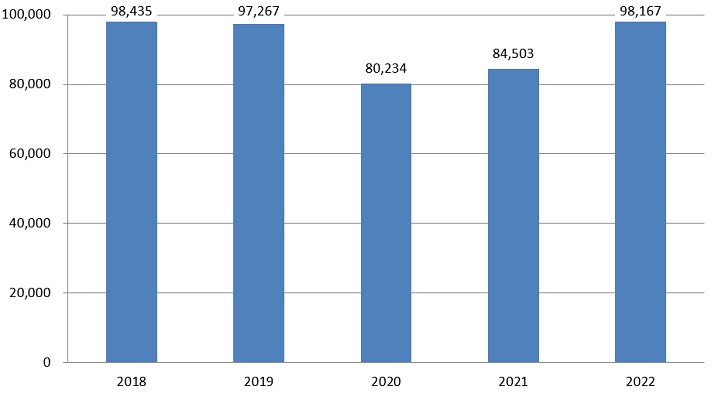
(Millions of yen)
| 2019/3 | 2020/3 | 2021/3 | 2022/3 | 2023/3 | |
| Net Sales | 98,435 | 97,267 | 80,234 | 84,503 | 98,167 |
 |
|||||
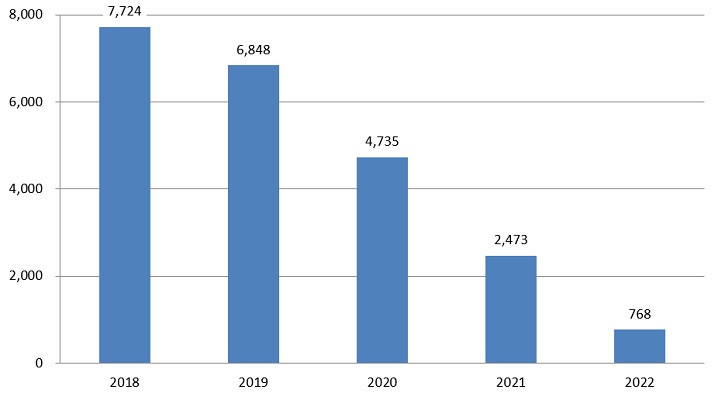
(Millions of yen)
| 2019/3 | 2020/3 | 2021/3 | 2022/3 | 2023/3 | |
| Operating Income | 7,724 | 6,848 | 4,735 | 2,473 | 768 |
 |
|||||